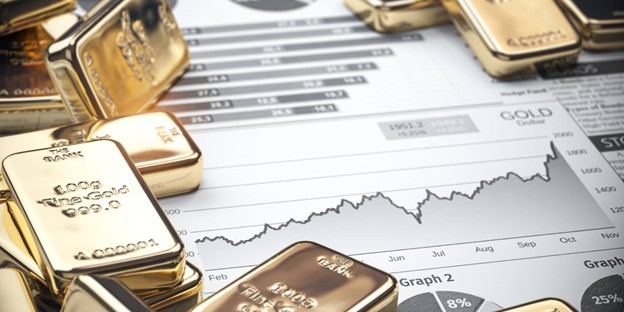
The second half of 2020 marked a banner period for gold, as its price per pound surpassed $20,000 for the first time ever. Amid the economic downturn and uncertainty caused by the COVID-19 pandemic, investors rushed to gold as a safe haven investment and hedge against the shorter-term risk of traditional markets.
In the early months of 2021, however, we have seen gold come somewhat back to earth, currently sitting at around $1,780 per ounce at the time of writing. As vaccination progress has been made and a shift toward the new normal seems ever on the horizon, many investors have closed out their positions on gold in favor of more conventional stocks and bonds.
If you were someone who took advantage of the heights of gold by selling your jewelry, coins, and other items for cash during the second half of last year, you’re likely feeling good about your decision. If you’re someone who hesitated or sat on your hands through the bull run only to see the price decrease in recent months, you may be feeling frustrated or like you missed the boat.
But fret not, because the price of gold is still higher than it has been throughout most of history, and there may be a valid reason for further optimism regarding its price moving forward. A key stock market indicator suggests the precious metal has some room to run in the coming months.
Here is a closer look at what this indicator means and why it represents an ideal window for selling gold and other precious metals in 2021.
The Stock Market Indicator
The indicator in question is the ratio of stock market capitalization to GDP (i.e. the value of all holdings in the stock market versus the U.S.’s total earnings in a year). Throughout the past century, each time this particular metric has reached a high point, the price of gold has increased shortly thereafter. And right now, the ratio is peaking, once again.
Previous Peaks
The market cap to GPD ratio has peaked several times in the past, with each occurrence being followed by an increase (and eventual decrease) in gold price.
In 1928, the ratio hit a peak of 98% just before the Great Depression and WWII. Following the peak, gold’s price increased.
The ratio hit a high point once again in the early 1970s, just before gold went on another steep price run.
Then, at the height of the dotcom bubble in 2000, the ratio hit an all-time high of 137%, followed by gold gaining value once again.
Current Peak
Today, we’re seeing a similar apex in this particular indicator, which has surpassed 200% for the first time in history. This means the value of the stock market is more than double the GDP.
But What Does This Mean for Gold?
If history is a guide, the current peak means we could be on the verge of another spike in the price of gold – but history also tells us it will not last forever. Previous peaks of the market cap to GDP ratio were followed by bear markets on Wall Street, which would also bode well for the price of gold as investors return to it as an alternative vehicle as they did in 2020.
The Fed is also printing trillions of dollars, which will lead to further inflation. Since gold often serves as a safe haven during times like these, many may be looking to turn their old or unwanted jewelry into coins or bars.
As the price and future outlook of gold begin their uptrend, now is the perfect time to see what your precious metal items are worth and to sell them before prices begin to decline once again.
At Gold Guys, we are dedicated to getting you a high price for your gold and other precious metals while ensuring the process is easy and painless. We work with you to ensure you’re in control of the transaction from start to finish at no cost to you.
Contact us today to learn more about selling your gold, jewelry, and other precious metals for a great price with Gold Guys.

